

DISCLAIMER: This is not financial advice, and you should not consider it to be. The content is for informational and educational purposes only.
The memo was written on April 6, 2026.
CREDIT INVESTMENT AND THESIS:
MGM Resorts International is a global gaming, entertainment, and hospitality company operating integrated casino resorts across Las Vegas, regional U.S. markets, and Macau, with a growing digital gaming presence through BetMGM and LeoVegas. I recommend holding (not initiating) the 6.50% Senior Notes due 2032 for the following factors:
Low Default Risk But Insufficient Spread Compensation at Current Levels: MGM has a strong EBITDAR of $4.6B and total liquidity of $3.7B, making default before the 2032 maturity extremely unlikely under any reasonable scenario. MGM also has credit-friendly characteristics of steady EBITDAR (from gaming). However, the bond is currently trading at 233bps spread, below (tighter than) the average BB spread of 250bps, despite being rated B+/B1/BB-. The market is pricing an upgrade, even though FCF metrics (especially after share repurchase) do not support the upgrade yet. At the current spread, the bond offers no meaningful upside but is exposed to a significant downside (repricing at a B spread of 350bps). Therefore, risk-adjusted return is not sufficient.
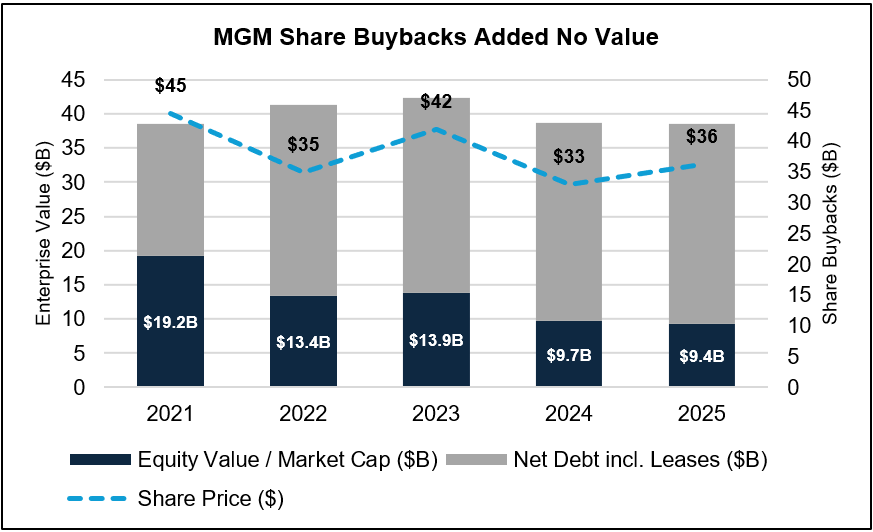
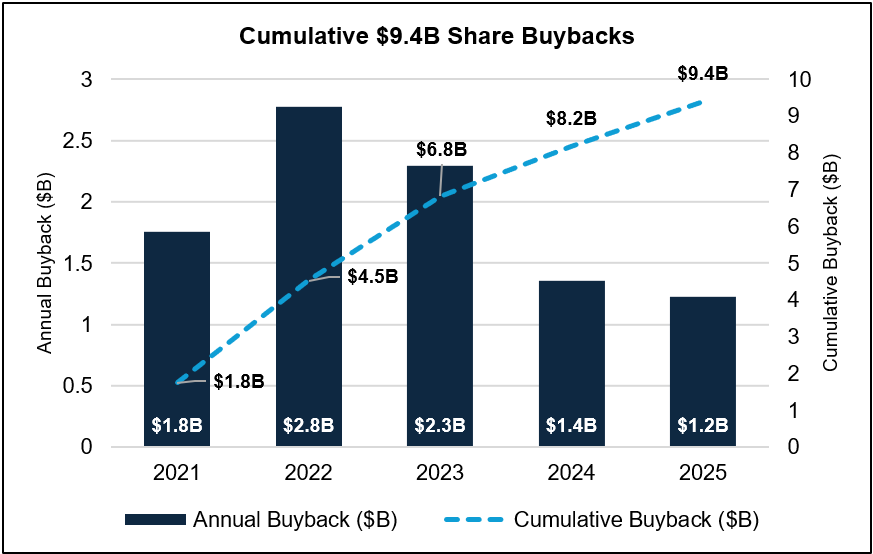
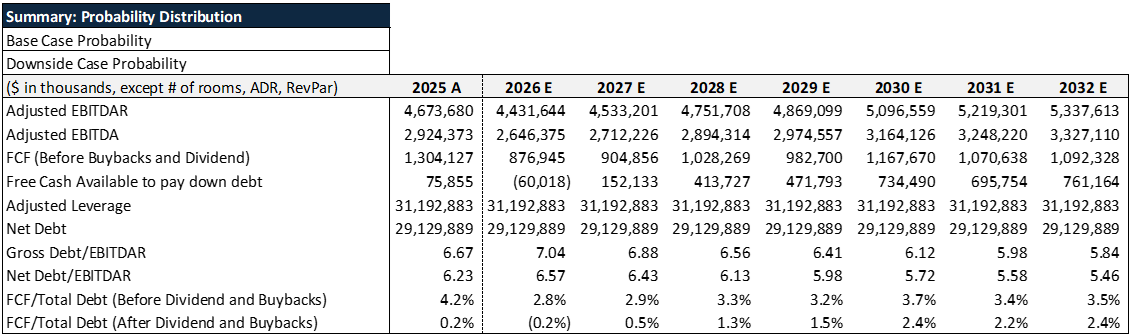
Share Buybacks Suppress FCF: MGM has repurchased $9.4B of its own shares from 2021 to 2025, and yet has created no value. From a credit perspective, this is the central constraint: MGM generates $800M-$900M in pre-buyback FCF annually in a probability-weighted scenario, but is expected to spend over $1,000M in share buybacks. FCF/Total Debt after buybacks is only 1-2%, insufficient for a BB upgrade.
Call Option Caps Upside: Even if MGM executes on its deleveraging plan (although the management clearly stated its priority to continue share buybacks) and gets an upgrade to BB, the bondholders’ upside is structurally capped by the call option. The bond becomes callable at 103.25 beginning April 15, 2027 (two years from today). The bond is already trading at a premium of ~101. If MGM refinances at a tighter spread, the bondholder loses the 6.50% coupon with minimal capital appreciation. Also, there will be a significant reinvestment risk in an environment where MGM refinances the bond.
Las Vegas Structural Deterioration: Las Vegas, which represents 48% of revenue and is the primary driver of EBITDAR and FCF, has plateaued at around $8.4B in revenue, and it is structural. The key metrics (after adjusting for comp/SSP reallocation) show deterioration: lower table drop growth, lower slot handle growth, declining cash-adjusted occupancy for rooms, declining ADR growth, while comp intensity has risen from 33% to 48% from 2021-2025.
INDUSTRY OVERVIEW:
Casino Resorts: the casino resorts industry operates an integrated model combining gaming, food and beverage, hospitality, and entertainment. The industry is mature, highly regulated, capital-intensive, and cyclical, sensitive to macro conditions and discretionary spending. The industry revenue (in the U.S.) grew at a 2.1% CAGR from 2021-2026, with growth expected to decelerate to ~1.4% CAGR from 2026-2031 as the post-pandemic recovery tailwind exhausts and the industry approaches saturation due to more competition.
Gaming revenue is relatively stable and less cyclical, but non-gaming revenue (rooms, F&B, entertainment) is highly macro-sensitive, driven by consumer discretionary spending, employment, and tourism trends/visitation, particularly in Las Vegas and Macau, where visitation is the key driver.
High-rollers represent 1-2% of visitors but historically generate 20-30% of gaming revenue, creating disproportionate revenue concentration and making gaming revenue less sensitive to the mass economy.
Structural shift toward non-gaming revenue is ongoing across the Las Vegas Strip, increasing exposure to consumer discretionary cycles.
Online gaming (iGaming/OSB) is growing with a structural headwind, particularly for regional casinos, where drive-to customers represent the majority, and iGaming provides an at-home substitute.
iGaming/OSB: the iGaming/OSB industry is a high-growth and regulation-driven industry that has expanded rapidly since PASPA’s repeal in 2018, enabling state-level legalization. The industry generated ~$29.7B of revenue in 2026, growing at a 27.8% CAGR from 2021-2026, with growth expected to moderate to ~9% as markets mature. The market remains highly competitive and concentrated among scaled operators (e.g., FanDuel and DraftKings), with profitability dependent on achieving scale and reducing promotional intensity.
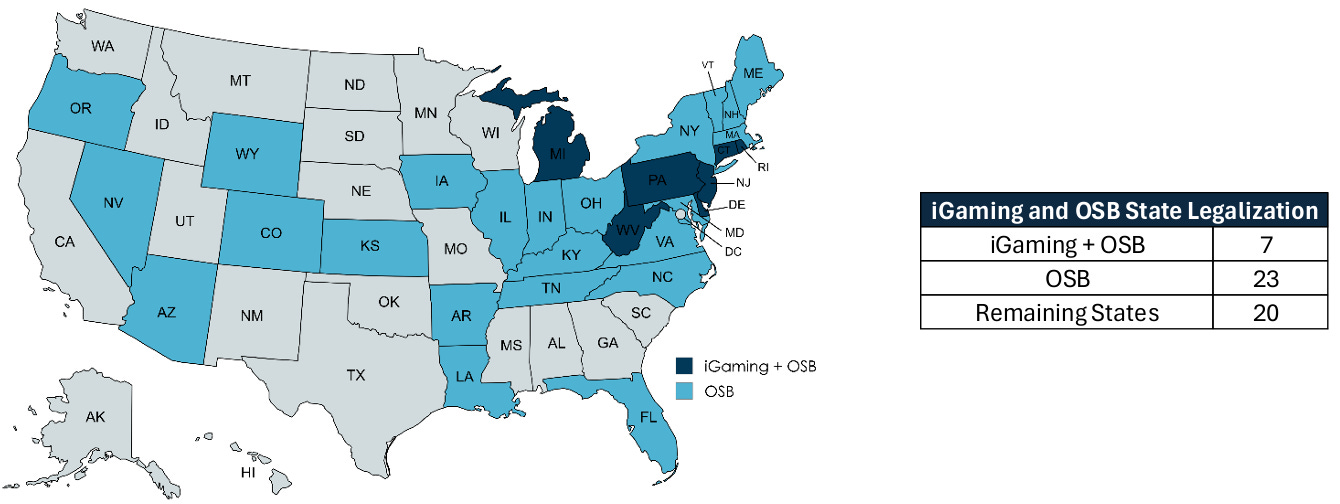
State legalization expansion and regulatory trajectory: each new state legalization expansion expands TAM. So far, 23 states have legalized OSB and 7 have legalized iGaming, with 20 states remaining.
Product and Technology differentiation: broader game libraries and superior technology matter for competition.
Market Structure is highly concentrated with C4 > 80% on both iGaming and OSB, dominated by FanDuel and DraftKings. The industry has a structurally high customer acquisition cost and promotional intensity.
COMPANY OVERVIEW:
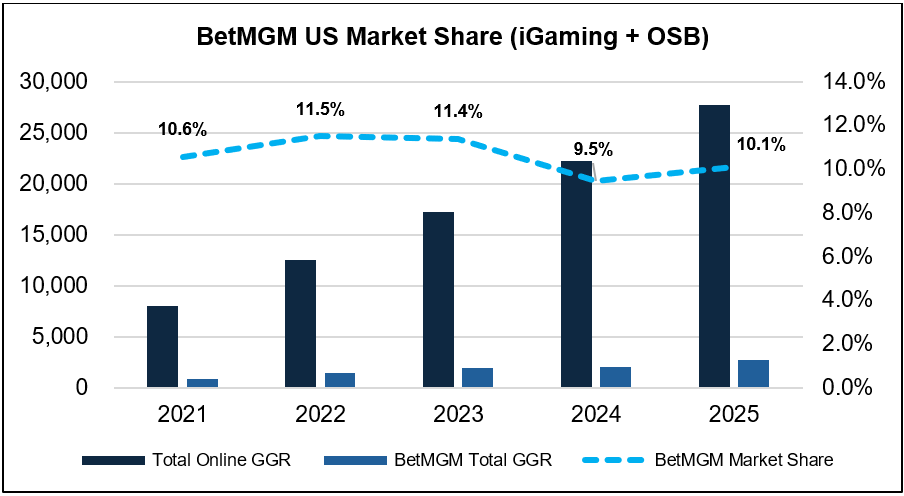
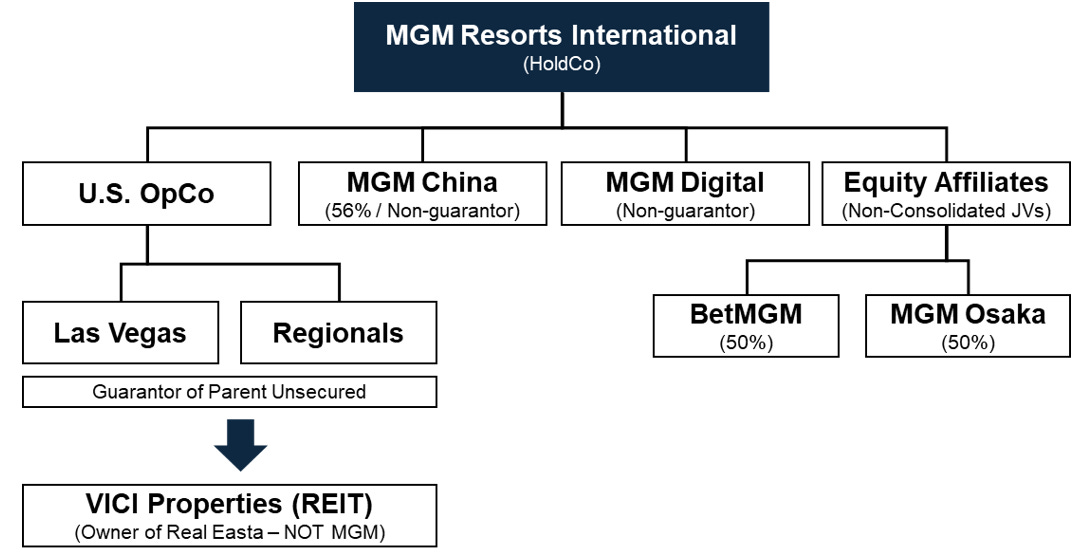
MGM Resorts International (“MGM”) is a global gaming, entertainment, and hospitality company that owns and operates integrated casino resorts across Las Vegas, regional U.S. markets, and Macau, while expanding its digital gaming presence through BetMGM and LeoVegas. MGM has a diversified portfolio of well-known sites, including Bellagio, Aria, The Cosmopolitan, and MGM Grand, as well as BetMGM (50% stake), the third biggest U.S. online sports betting (OSB) and iGaming operator. The company operates an asset-light model (divested old MGM to OpCo and PropCo, selling all domestic real estate to VICI and leasing it back) to redeploy capital into faster-growing digital gaming (4% of revenue) and share buy-backs while maintaining its Las Vegas Strip flagship (48%) and secularly declining Regional (22%) and recovery in MGM China (25%).
Las Vegas (48.1% of revenue) generates revenues from casino gaming, hotel rooms, food and beverage, entertainment, retail, and others, across nine integrated resorts with 37,000 rooms. Over the past five years, the revenue dynamic has shifted from gaming (33%→24%) to non-gaming (67%→76), making the segment more correlated to consumer discretionary spending and travel demand rather than pure gaming volumes. Las Vegas generated $2,858M in adjusted EBITDAR (34% margin) in 2025. Las Vegas Strip has two main drivers:
Mass-market visitors: driven by disposable income and employment. Visitation to Las Vegas is critical for Las Vegas casino hotel revenue. Mass-market visitors save up, book a flight, and spend a fixed budget. Trips to Las Vegas are discretionary, and any impact on their wages (disposable income) and employment (unemployment rate) will result in lower visitation.
High-rollers: a player whose gaming budget exceeds $100,000, represent 1-2% of visitors but historically generated 20-30% of gaming revenue.
Most of Las Vegas Strip’s growth has been due to an increase in comp intensity (SSP Reallocation). More will be discussed in “Financial Statement Analysis.”
The growth of Las Vegas Strip’s revenue and its FCF is most critical in our analysis.
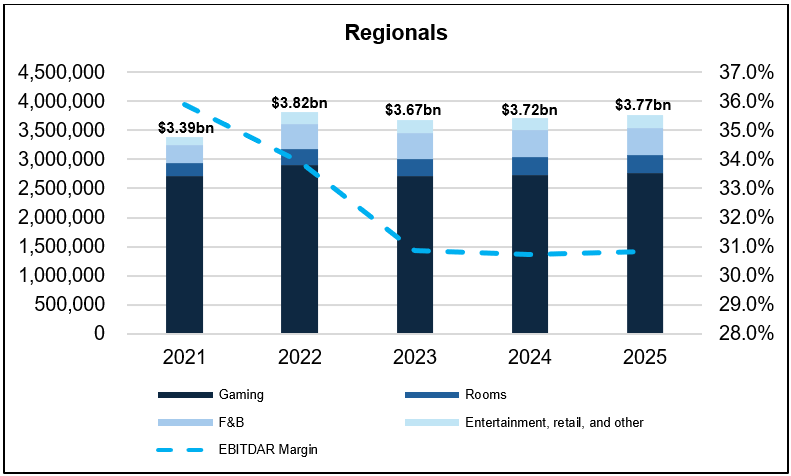
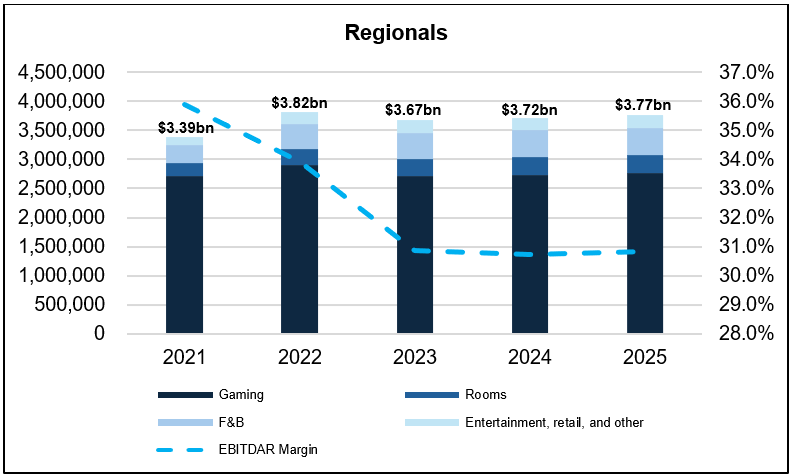
Regional (21.5% of revenue) generates revenues mostly from casino gaming (73.5%) across seven properties in Michigan, New Jersey, Mississippi, Maryland, Massachusetts, New York, and Ohio. Regional casinos are focused on local and drive-to customers with a high slot mix and a more stable (recurring) demand profile. Regionals generated $1,163M adjusted EBITDAR (30.8% margin) and have been very consistent.
Higher slot machine mix (77%) relative to Las Vegas (20%), providing more stable hold rates and less high-roller volatility
Important for cash flow stability, given lower volatility compared to LV and China.
Revenue growth has been flat to slightly positive (2% 5yr-CAGR), and faces potential cannibalization from iGaming as it offers an at-home substitute over a 1-hour drive to local casinos.
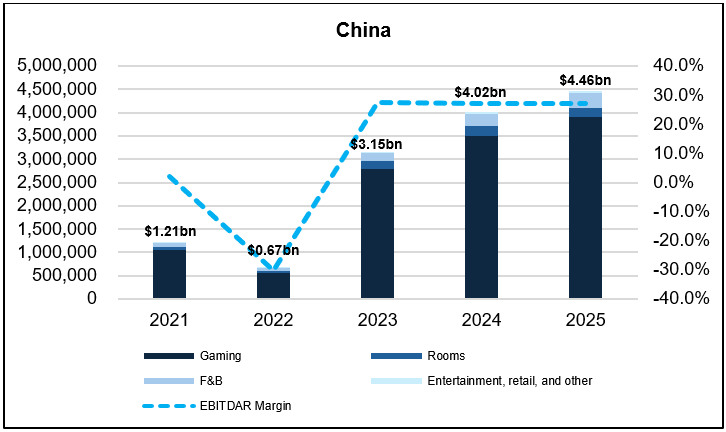
MGM China (25.4% of revenue) generates revenues mainly from gaming operations at MGM Macau and MGM Cotai, operating under a gaming concession expiring December 31, 2032. Revenue is overwhelmingly gaming-driven, and gaming recovered sharply from the pandemic with 30% 5yr CAGR. However, Macau has a high gaming tax (35% on GGR), leading to a lower segment EBITDAR margin of 27%. MGM China generated $1,203M adjusted EBITDAR (27% margin).
MGM China is structurally separated from MGM (the parent)
MGM China shows fast growth in both revenue and EBITDAR.
Gaming revenue accounts for 88% of total revenue, and it is very dependent on high-rollers. However, gaming revenue tends to be less cyclical than non-gaming revenue, providing steady cash flow.
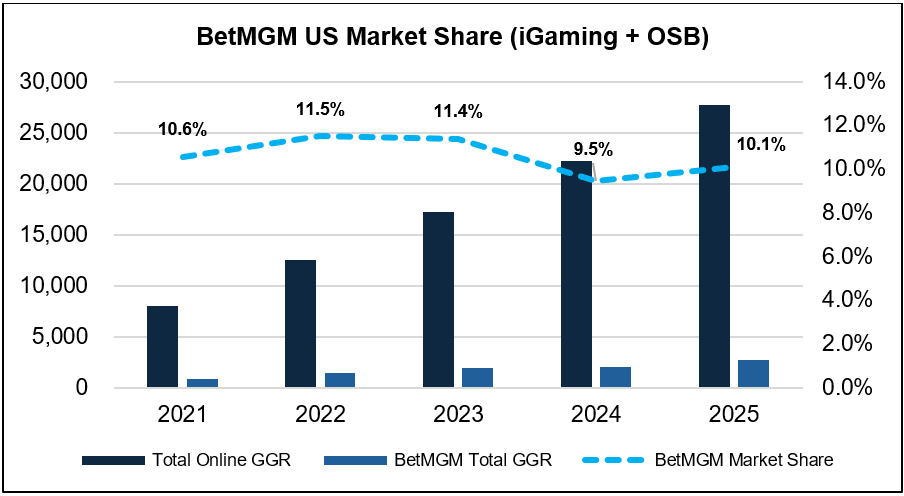
MGM Digital (3.7% of revenue) is a consolidated online gaming portfolio comprised of LeoVegas and BetMGM. Revenue is generated from iGaming, digital slots and table games, live dealer, and online sports betting (OSB). This segment growth is critical for MGM’s growth narrative. MGM’s growth or expansion narrative is closely tied to MGM Digital.
The Joint Venture structure limits MGM’s strategic flexibility. MGM (the parent) does not have full discretion.
BetMGM is the third-largest U.S. iGaming and OSB operator, significantly behind FanDuel and DraftKings.
The segment’s revenue grew at a 48.8% 4yr CAGR from 2022-2025, but is decelerating as markets mature. MGM Digital generated a negative EBITDAR of approximately ($90M) in 2025, and continues to lose from higher competition and capital expenditure
MGM Digital is a call option for MGM for online gaming


MANAGEMENT:
William (Bill) Hornbuckle is the President and CEO of MGM Resorts International. Bill started his career in hospitality at age 18, working as a bartender, attended hospitality school at UNLV, and began his career as a room service attendant and assistant hotel manager at multiple resorts in Las Vegas before joining MGM in 1998. Bill is an almost 40-year gaming industry veteran and a 30-year MGM loyalist. He is very bottom-up, deeply involved in the details of operations, including marketing, designing, strategy, and hospitality. Bill initiated asset-light transformation in 2016 and sold MGM Growth Properties in 2021 for $17.2B. He then initiated an aggressive share buyback program totaling $9.4B, reducing shares outstanding by approximately 47%, which is a significant concern from a credit investor’s perspective. The aggressive share repurchases, while barely improving shareholder value, have significantly leveraged the company. This is very concerning and further discussed in “Key Risks.” Bill’s contract was extended last year to serve until 2028, primarily to oversee MGM’s secondary growth narrative – MGM Osaka.
FINANCIAL STATEMENT ANALYSIS:
(i) Revenue and Profitability
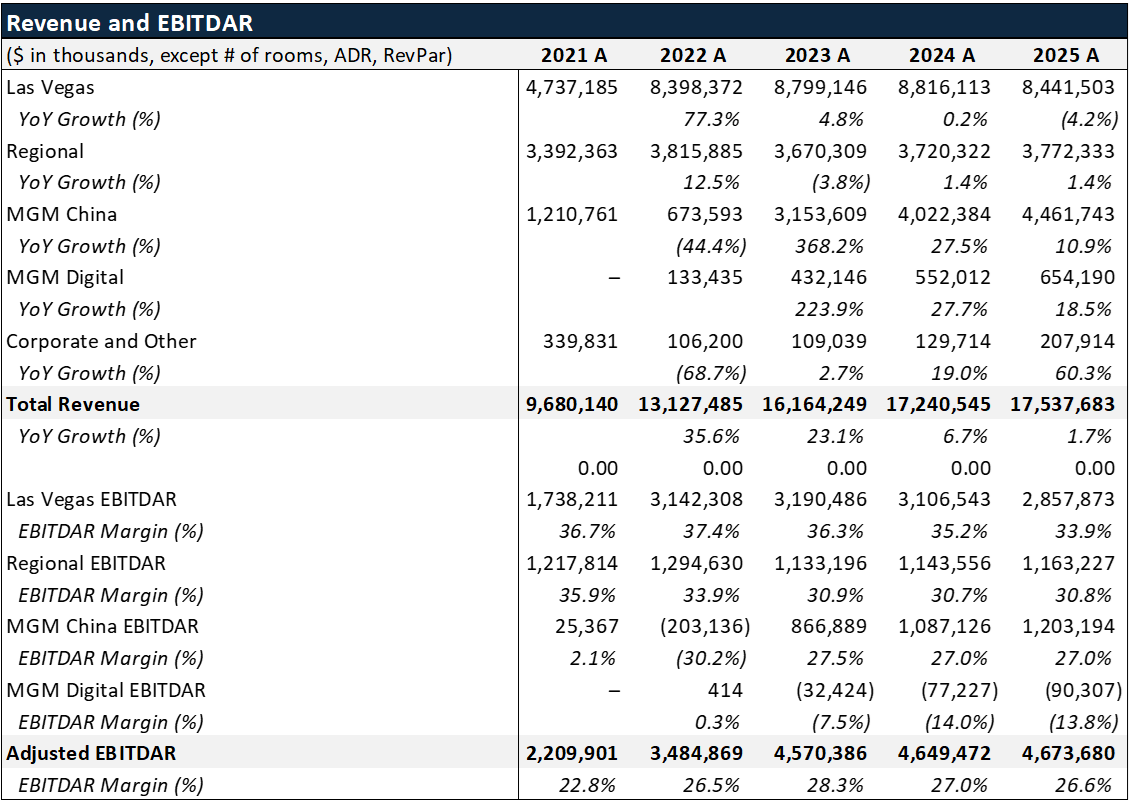

Las Vegas: Las Vegas is the largest segment with 48% of revenue, but has plateaued. Following an exceptional post-COVID recovery that drove 77% growth in 2022 and 5% in 2023, the segment has stalled, growing only 0.2% in 2024 and declining 4.2% in 2025 to $8.4B.
The deceleration reflects a structural shift in consumer demand (and their sentiment of Las Vegas and MGM) rather than a one-time event.
The underlying metrics are deteriorating: slower table drop growth and slot handle growth, declining cash-adjusted ADR, while comp intensity has risen from 33% to 48%, meaning MGM is spending more on promotion but is unable to draw traffic.
As a result, Las Vegas EBITDAR margin has compressed from its peak of 37.4% in 2022 to 33.9% in 2025, driven by higher labor costs, comp escalation, and fading pricing power in rooms. We do not expect a meaningful recovery in the near term. More discussed in “Forecast.”
Regional: Regional is the most stable segment, generating consistent low-single-digit growth. Regionals showed less COVID-driven distortion; revenue declined in 2023 due to property-specific factors before recovering. EBITDAR margin has compressed modestly from 35.9% in 2021 to 30.8% in 2025, reflecting labor inflation.
MGM China: China is the highest-growth segment, recovering sharply from its COVID-era collapse. Revenue fell 44% in 2022 as Macau closed, then rebounded 368% in 2023 with the market reopening, and continued to grow at 27.5% in 2024 and 10.9% in 2025, now generating more revenue than regionals. EBITDAR margin has stabilized around 27%, structurally lower than LV due to higher gaming tax.
MGM Digital: MGM Digital is a fast-growing but also cash-burning segment, growing from 0 in 2021 to $654M in 2025, driven by BetMGM’s NA expansion and acquisition of LeoVegas. Despite strong top-line growth, the segment remains unprofitable, generating EBITDAR of -$90M in 2025. The losses reflect structurally high customer acquisition costs and promotional intensity required to defend its third-place market share against FanDuel, DraftKings, and new entrants.
Overall, the consolidated EBITDAR margin peaked at 28.3% in 2023 following the post-COVID recovery, then compressed thereafter. The compression reflects three factors: Las Vegas slowing down from pricing fatigue and rising costs, MGM Digital’s cash burn, and MGM China’s slower growth after recovery.
Note on Casino Accounting:
Casino operators report gaming on a net basis and non-gaming revenue on a gross basis after comp allocation, which is complimentary rooms, F&B, and entertainment provided to gaming customers. The comp allocation distorts the true economics of each revenue line. For example, when MGM provides a complimentary room to a high-roller, the retail value of the room is recorded as both hotel revenue and contra-revenue for gaming revenue, inflating non-gaming revenue (ADR and Occupancy) and deflating gaming revenue. Therefore, we adjusted comp allocation and calculated Adjusted ADR and Cash Occupancy to reflect the true economic nature.
Warning Sign:
Las Vegas: Showing Early Signs of Pricing Fatigue
MGM’s Las Vegas segment revenue has plateaued for the past few years, at around $8.8B. The underlying metrics are deteriorating: lower table drop, lower slot handle, declining room cash-occupancy, decreasing cash-ADR, and increasing comp. The post covid recovery that drove the demand from 2021 to 2023 is now exhausted, and the market is seeing weaker demand.
MGM and the broader Strip made a strategic mistake of raising room rates, expanding resort fees, and re-pricing F&B to levels that broke the Vegas value proposition for the mass-market visitors. When a bottle of water now costs $8 and a resort fee adds $50 a night on top of increased ADR, the visitors will choose different destinations.
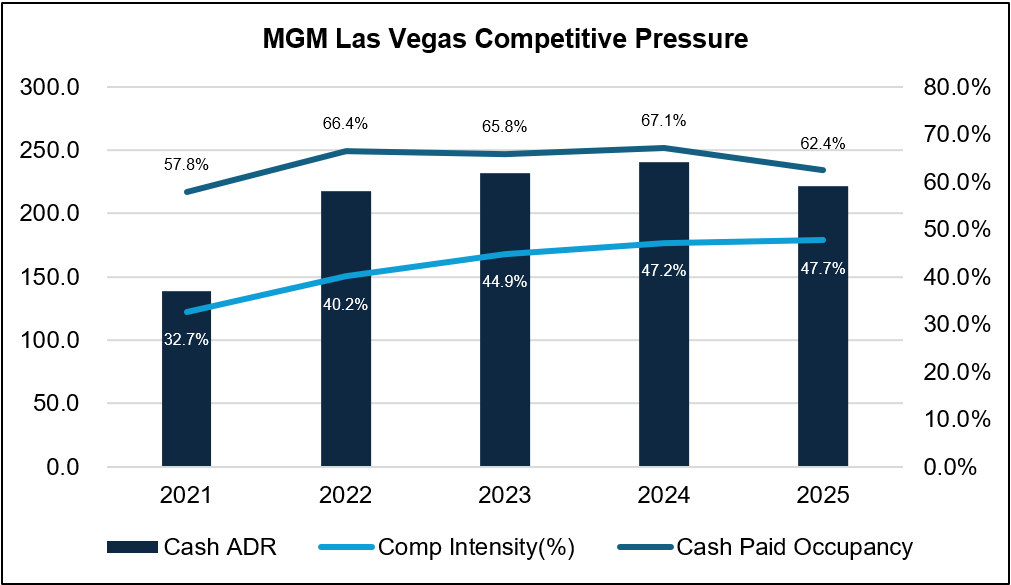
Losing Pricing Power: Cash ADR, which shows the pricing power of casino hotels, is slowing in growth and has gone negative for 2025. At the same time, comp intensity is increasing (33% -> 48%), a clear signal of losing pricing power and the unattractiveness of Las Vegas’s value proposition.
(ii) Cash Flow, Liquidity, and Capital Structure
Capital Structure Analysis:
At first glance, MGM does not appear highly leveraged. Net Debt (only traditional Net Debt, excl. lease) is only $4.17bn (LTV: 30.1%, 1.46x EBITDA), compared to an equity value of $9.38bn. However, this understates the company’s true leverage because real estate is fundamental to its operations, and MGM has a 23-year obligation. MGM is legally obligated for the next 23 years, cannot operate without its properties, nor can it relocate assets. Therefore, its long-term lease obligations are effectively debt.
When the lease obligations are accounted for, Net Debt increases to $29bn (LTV: 76%, 10.17x EBITDA), revealing a much more levered capital structure.
However, using MGM’s reported PV of lease also introduces distortion. MGM’s lease terms are significantly longer than the industry (23 years vs 5-10 years), which meaningfully inflates the PV of lease liabilities relative to peers. More importantly, I believe longer leases, given a casino resort’s unique characteristics, are strategically rational. Casino operators are inherently tied to specific locations and cannot relocate. Therefore, a long-term lease protects the operator from an increase (renegotiation) of lease expense. MGM only has 2% step up every year.
To normalize for comparability, I applied the industry standard approach of applying an 8x multiple to lease expense. On this basis, MGM’s adjusted leverage is lower than the PV approach and is more consistent with benchmarking.
Therefore, we added lease obligations to reflect MGM’s true indebtedness, which makes MGM look much more levered than before.
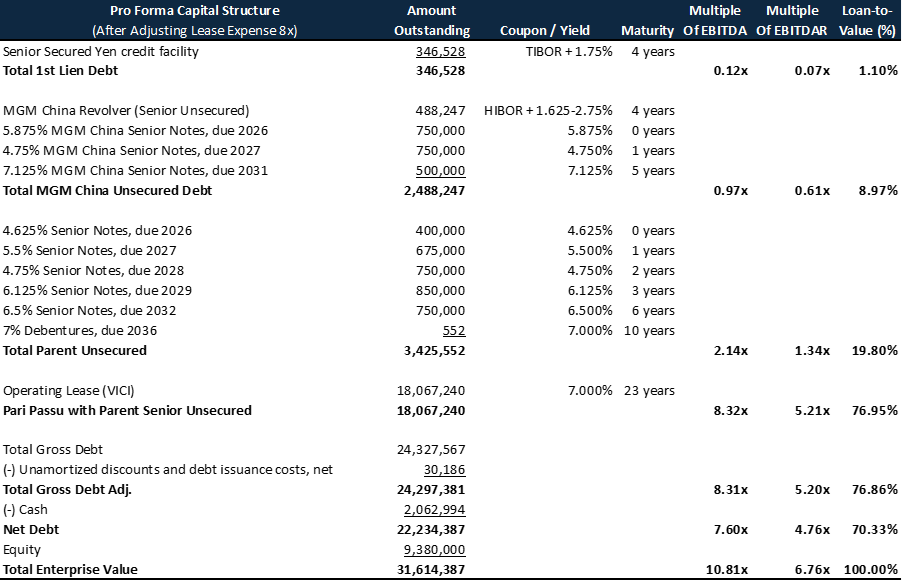
The analysis and adjustment demonstrate that MGM is not as levered as the market views.
Liquidity Analysis:
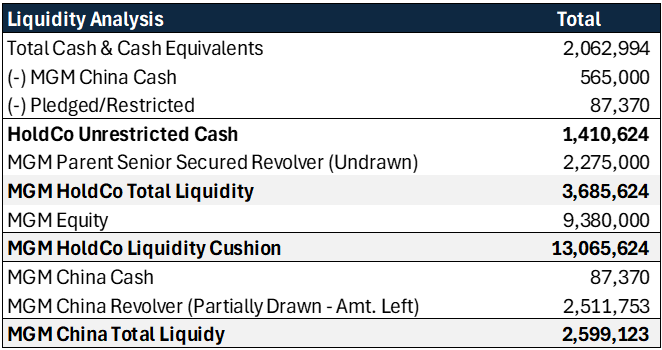
Further, MGM has strong liquidity. MGM has $1.41bn unrestricted cash, $2.27bn of undrawn senior secured revolver, totaling $3.68bn in liquidity. In addition, MGM has a nice cushion of $9.4bn in equity value, while the company has $5.4bn in debt and $18bn in operating leases.
KEY RISKS AND MITIGANTS:
The primary risks for MGM are Las Vegas Strip losing attraction and visitation, cannibalization of Regionals from online gaming (iGaming + OSB), a 23-year long-term lease contract, and aggressive share buyback. Non-gaming revenue is cyclical and very dependent on Las Vegas visitation numbers.
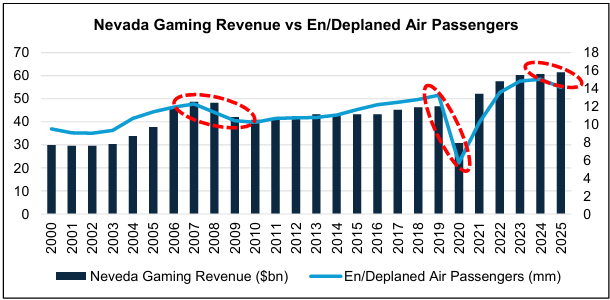
1. Las Vegas Losing Pricing Power: as mentioned earlier, the number of en/deplaned air passengers in Las Vegas (a proxy for Las Vegas casino visitation) is slowing down. On top of that, MGM Las Vegas is increasing comp intensity while cash paid occupancy and adjusted ADR are decreasing, signaling that MGM is spending more money to increase traffic, yet people are less willing to visit and play games.
a. Mitigant: our projection adjusted comp intensity to room revenue and calculated adjusted ADR to reflect the true consumer sentiment. Also, our projection includes modest growth for ADR and occupancy for both base and downside cases.
2. Online Gaming Cannibalizing Regionals: Regionals produce mostly gaming revenue and have been stable for decades. Regionals provide stability and steady cash flow. However, online gaming, especially with iGaming licenses in certain states, is partially cannibalizing regionals.
a. Mitigant: our projection (even for base case) is very conservative, assumes increased iGaming cannibalization and slower growth in regionals gaming revenue. Also, BetMGM and MGM Digital partially capture the cannibalized revenue.
3. Long-term Lease Contract: MGM has an obligation of about $25bn under all circumstances, regardless of the performance of the properties for the next 23 years. The lease also includes automatic 2% annual escalators.
a. Mitigant: our projection includes 2% annual escalators and accounts for lease liabilities for leverage calculation. However, long-term lease contracts are not materially disadvantageous for MGM given casino resort’s unique circumstances. Therefore, a 23-year contract actually protects MGM from potential lease cost increases from frequent renegotiation.
4. No Value-Add from Share Buybacks: I believe this is the major, and often overlooked, risk. The company has repurchased $9.4bn of shares over 2021-2025 and has created no value for equity holders, at the expense of creditors.
a. Mitigant: our projection includes modest share buyback for base case, arguing that management will soon realize that buyback is not the answer for maximizing shareholder value, and downside case includes the same aggressive buyback, believing that management will commit the same mistake.
5. MGM Osaka – Unlimited Completion Guarantee and Cost Overrun risk: MGM has committed $2.3B remaining to fund MGM Osaka through 2028. MGM committed an uncapped guarantee to fund completion, meaning if the completion delays or cost overruns, MGM will need to finance much more than expected. If costs escalate, MGM’s cash flow will be severely impacted.
a. Mitigant: we do not have the ability to accurately predict MGM Osaka’s completion details. We believe the cost impact is difficult to quantify and have therefore excluded it from the forecast.
6. MGM China Structural Subordination and Macau Geopolitical Risk: MGM China’s debt structurally subordinates MGM Resorts International’s bondholders. Also, the Macau government holds MGM China’s gaming concession, and the government can terminate it under any circumstances. As of today, the concession contract is scheduled to terminate in 2032.
a. Mitigant: Projecting/Predicting Macau’s government action is beyond our judgement. Therefore, it was not included in both base and downside cases. Also, the government termination is unlikely to occur, and the current gaming concession ends on December 31, 2032, after the recommended bond’s maturity.
FORECAST:
To forecast MGM, we must separate MGM into five distinct segments: Las Vegas Strip Resorts, Regional Operations, MGM China, MGM Digital, and Corporate and Other.
Our scenario analysis is primarily driven by the historical data and industry report on slower and steady growth in Las Vegas Strip Resort, a stable but secularly declining (or flat) regional operator, high-potential MGM China, and fast-growing but cash-burning MGM Digital. Cost assumptions for each segment were based on historical data and expected economies of scale (or worse, if revenue declines, costs as % revenue increases, given that some costs are fixed).
Capital Expenditure of each segment was also driven by historical data, but adjusted given each segment’s strategy and revenue growth.
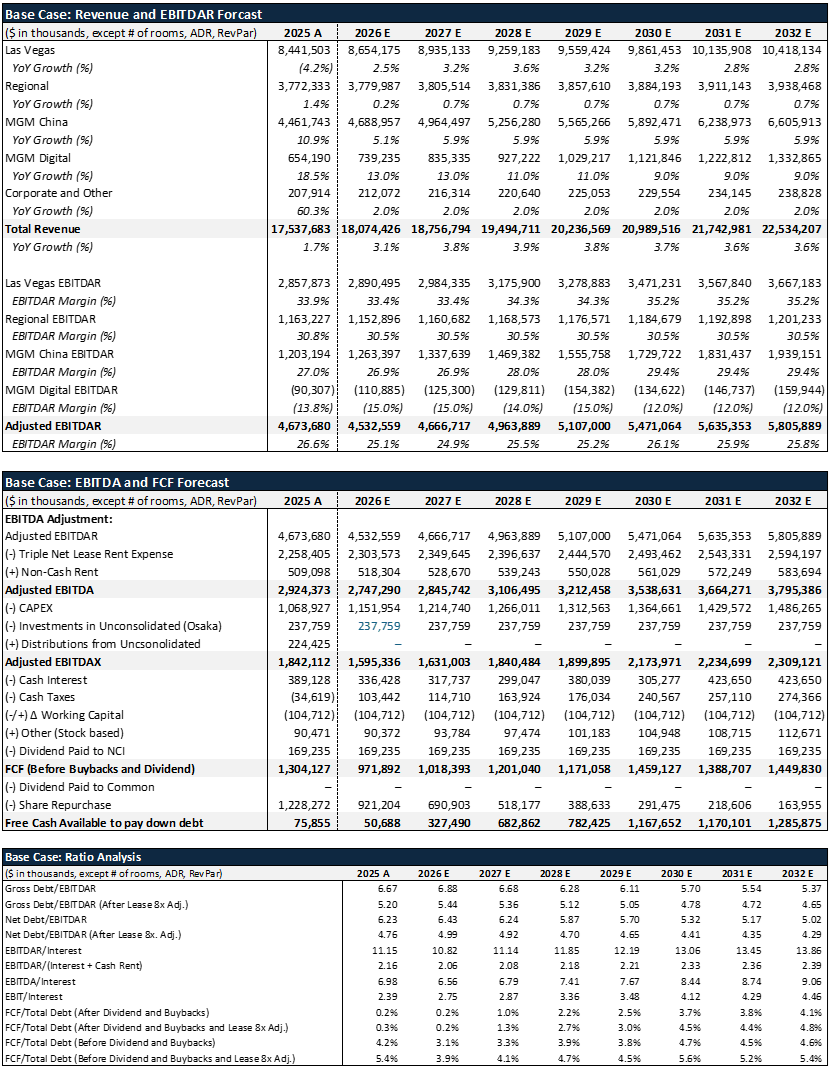
I believe the key to MGM credit analysis is understanding the management’s willingness to de-lever (i.e., their willingness to stop Share Buybacks and use that cash to de-lever or re-invest in businesses). This is where Base Case and Downside Case differ severely. Base Case will assume a slower rate in share buyback, while downside will assume the same or more aggressive share buyback. More is discussed later.
Base Case:
Las Vegas – Gaming: the past 5-year CAGR is 5.4%. However, this includes 2021 and 2022, when the revenue recovered from COVID. The table games drop increased 11.2%, and Slot Handle 10.2% 5-yr CAGR. This did not translate into gaming growth because table and slot handle increases were primarily due to an increase in comp allocation. Comp Intensity increased from 32.7% to 47.7%, which increased GGR but resulted in slower growth in net gaming revenue. Therefore, adjusted for the impact, we believe the growth in table games drop and slot handle is somewhere between 2% and 3%, and we believe comp intensity will slow from a peak of 48% to 45% by 2032.
Las Vegas – Non-Gaming: Las Vegas is shifting its revenue base from gaming to non-gaming. Even after adjusting for comp allocation (i.e., only considering cash revenue), room revenue grew 13.62%, F&B grew 16.6%, and Entertainment grew 9.7%. We believe such rates are unsustainable, as most of the gains reflected the post-pandemic recovery. Therefore, we assume modest 3% Adjusted ADR growth, 3% F&B growth, and 2% Entertainment growth. This is modest compared to historical.
Las Vegas – EBITDAR Margin: Although we believe Las Vegas will see some recovery in revenue, we believe that will come at the cost of higher comp and related promotion. Therefore, we expect EBITDAR margin to remain stable at 33%-35%, not reaching its peak 2022 rate of 37.4%. Again, this is modest compared to historical.
Regionals – Gaming and Non-Gaming: We believe there will be little to no growth in Regionals. We gave Table Games 0.0% growth rate, given its past five yr CAGR of 0.1%, and 0.5% for Slot Handle, given a 1.2% five-year CAGR. Our estimation is more modest than the historical one because we believe in possible cannibalization from iGaming, discouraging customers from driving to local casinos. The impact will be bigger on the downside. For non-gaming, we gave a very modest growth rate of 1% for Room and F&B, and 3% for Entertainment, even though they grew 7%, 8%, 10% respectively in the past five years. We believe they were mostly driven by post-pandemic recovery and comp intensity, and therefore, we gave a modest estimation.
MGM China – Fast Growing: MGM China showed incredible growth in the past five years. MGM China gaming grew 30% in the past five years, with main floor table games drop increasing 28.6% 5-yr CAGR. We believe high growth will continue, but at a much lower rate because the past five years’ growth is mostly from Macau and China recovering post 2022 from the pandemic. It is less likely that such growth will continue. Therefore, we gave a modest 5% CAGR growth instead of 30%.
MGM Digital – Fast Growing: Online gaming (iGaming + OSB) is one of the fastest-growing industries in the U.S., and MGM Digital has the third-biggest market share, although significantly behind the second-leader DraftKings. We believe MGM Digital will continue to demonstrate fast growth, but at a much slower rate. We believe 8.8% 7-yr CAGR compared to 48.8% 5-yr CAGR as the industry matures and more competition arises.
Share Buyback: We believe this is critical for our analysis, as MGM has sufficient liquidity and cash flow to de-lever its debt. However, the management has been focused on maximizing shareholder value, although it added no value, and did aggressive share buybacks in the past. Our base case assumption is that the buyback will slow by 22%. This is based on the fact that MGM has slowed down the repurchase at a rate of 18.4%, and MGM Osaka (expected in 2030) creates uncertainty, limiting repurchase.
Base Case Summary:
Downside Case:
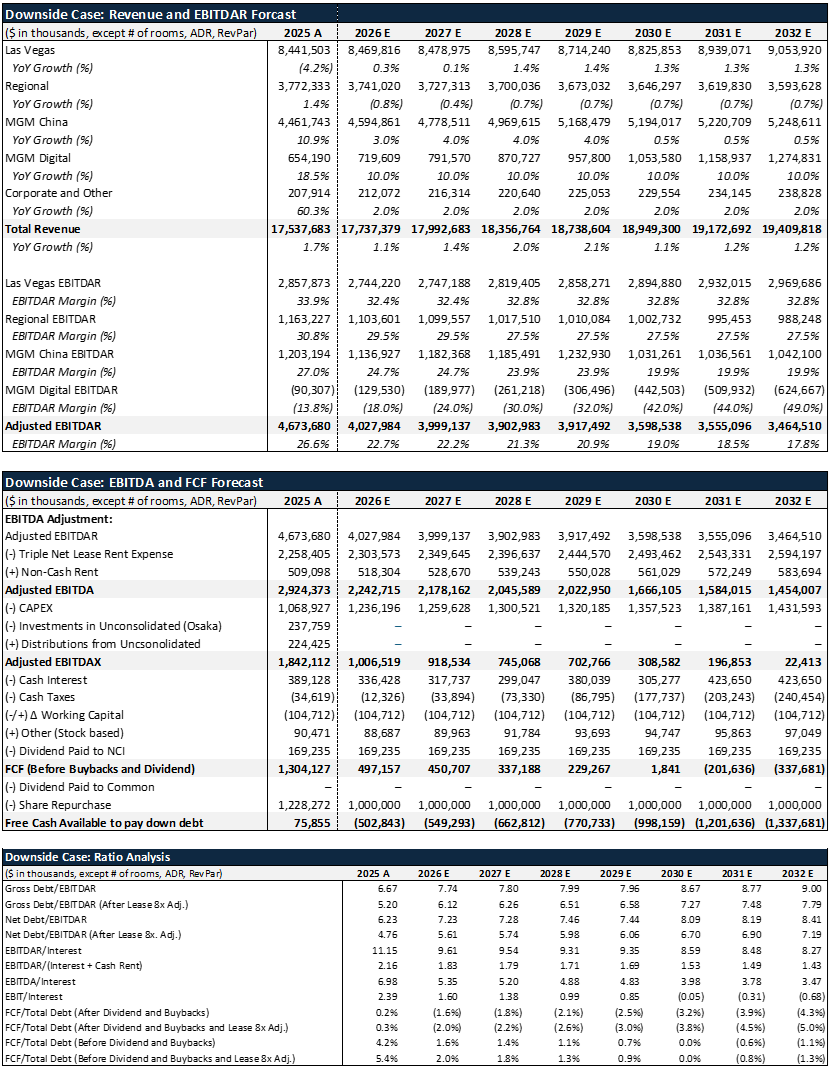
Las Vegas – Gaming: Our downside projection is very conservative. We project that table games drop and slot handle will only grow at 0.9% 7yr-CAGR, assuming Las Vegas visitation remains below prior expectations. To increase the traffic, MGM will increase comp intensity to 48%-49%, almost historically high.
Las Vegas – Non-Gaming: The room ADR Adjusted will decrease 1% 2026, then 0% in 2027, then modest 1% growth afterwards. This is because gaming will increase comp intensity, which will increase comp occupancy relative to the total occupied rooms, lowering cash occupancy. We also project more modest growth of 2% and 1% growth for F&B and Entertainment, respectively, even though they were the fastest growing in the Las Vegas segment. We believe overall lower visitation and an increase in comp will lower the quality of F&B and Entertainment offered, pressuring overall segment revenue.
Las Vegas – EBITDAR Margin: Lower growth in Las Vegas will increase Payroll % Revenue to 32%, Cost of Sales to 6.5%, and Other 26.4%, the highest out of the past five years. Also, a comp increase will have some impact on EBITDAR margin as comp allocation still has a marginal cost of delivering the service (whether room, F&B, or entertainment). Therefore, we project that the EBITDAR margin will be around 32%, which would be an all-time low.
Regionals – Gaming and Non-Gaming: Although Regionals have historically remained stable, we believe online gaming can cannibalize regionals. Many regionals’ customers drive more than an hour to go to a casino, and iGaming allows them to play games at home without having to drive. Therefore, we give -0.5% to -1.0% growth for table games and slot handle, and 0% growth for non-gaming. As a result, payroll % of revenue will increase to 25%-26%, which is an all-time high compared to its peak of 24.8%, and the cost of sales will increase to 5%-5.5%, much higher than the historical 4.5%. As a result, EBITDAR will be compressed to 29.5% to 27.5%, which is almost 3% lower than its all-time lowest EBITDAR margin of 30.7% in 2024.
MGM China: We believe that MGM China will continue to grow at a much faster rate than Las Vegas and Regionals. However, we give modest 4% growth in the main floor table games drop, and 0% after 2030, assuming that MGM Osaka will cannibalize MGM China’s operation. This is a very modest assumption. As a result, we expect EBITDAR margin to compress significantly from 27.0% in 2025 to approximately 19.9% by 2032.
MGM Digital: Online gaming is highly competitive. Although MGM and its affiliated online gaming companies have the third-biggest market share, MGM has been struggling to compete with the top two (FanDuel and DraftKings), which have more than 50% of the market. Therefore, our downside projection assumes that MGM Digital will continue to spend heavily to remain competitive without being able to monetize that spending.
Share Buyback: We believe management may continue its aggressive share buyback program. Management stated that it is still their “priority” to continue share buybacks, so we believe they will maintain approximately $1B in annual share repurchases. Management may also sell underperforming properties and use the proceeds to fund buybacks. They have done this in the past, most notably through the VICI REIT transaction and subsequent property sales.
Downside Case Summary:
Forecast Conclusion:
I believe Base Case is much more likely to happen than the downside case. Therefore, I distribute 80% possibility to the base case, and 20% to the downside case.
COVENANT ANALYSIS:
MGM 6.5% Senior Notes 2032 is covenant-lite as the company has strong going-concern cash flows and steady revenue dynamics.
Call Option: the bond is callable before April 15, 2027, make-whole at T+50bps, and after April 15, 2027, at 103.250%. (2028: 102.167%, 2029: 101.083%, 2030: 100%)
Change of Control Put: MGM has a CoC put at 101% of par plus accrued interest. A change of control is defined as anyone acquiring greater than 50% of voting stock or the board changing majority within two years of a proxy contest.
Cross-default threshold: meaning, if any debt greater than the $200M threshold defaults, the bond automatically defaults as well
The bond is pari-passu with $2.765B of other parent unsecured, subordinated to a $346M secured yen facility and structurally subordinated to $2.49B MGM China debt.
RETURN/RELATIVE VALUE ANALYSIS:
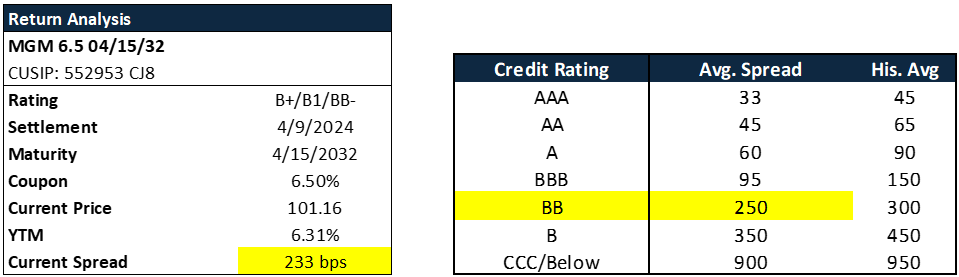
Although MGM is B+/B1/BB- rated, the spread is very tight (almost upper BB spread). The market believes that MGM should be trading near BB to BB+, and that is why the bond is trading at a premium ($101). Although MGM is a high-yield rated bond, it is highly unlikely that it will default until the maturity of the bond (2032). The analysis should focus on whether the management will continue to buy back shares aggressively or not. If the management stops the buybacks, the bond will more likely than not be upgraded to BB. However, if they continue the buybacks at a similar rate, the bond will stay around B.
I believe the most important metric is FCF/Total Debt, as the company generates strong EBITDAR and is decently leveraged.
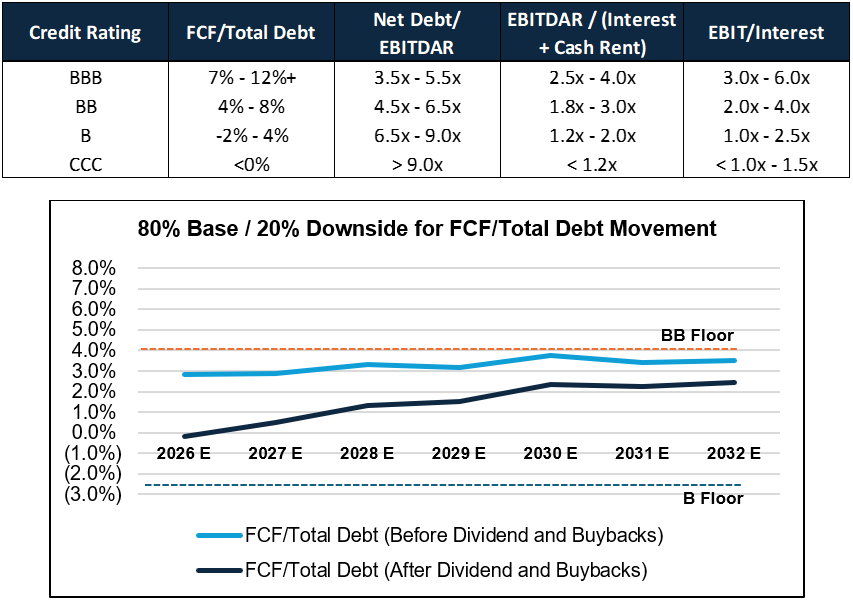
Although the Bond is trading at a premium, priced at BB, I believe it is less likely that it will be upgraded to BB because of its FCF Yield. Although MGM is less likely to file for bankruptcy and has strong EBITDAR and EBIT (coverage ratio), its leverage ratio and free cash flow generation are concerning, especially after the share repurchase.

Additionally, given that the current spread for BB and B is historically tight, if the spread were to widen to the historical average, it would result in a price change of -13.02%.

The management still believes that it is their “Priority” to continue share repurchase, and therefore, I believe that investing in the MGM 6.50% 2032 does not offer a sufficient risk/return profile. I don’t see MGM getting upgraded to BBB, and it is already trading at BB. There is not much marginal return even if MGM is upgraded to BB, but there is significant downside risk if the bond were to be repriced at B spreads (where it is rated now). The call option structurally caps the upside, while the downside from widening spread (though low probability) is significant. While the company’s credit profile is too strong (strong EBITDAR and consistent FCF) to justify a sell recommendation, the asymmetric risk/return profile, capped upside from the call, and meaningful spread widening risk do not support initiating a position. Therefore, I recommend Hold.