

DISCLAIMER: This is not financial advice, and you should not consider it to be. The content is for informational and educational purposes only.

The memo was written on February 26, 2026.
CREDIT INVESTMENT AND THESIS:
Paramount is one of the largest global media conglomerates. I recommend underweighting 4.95% Senior Notes due 2031 for following factors:
Increasing competition: Paramount+ is competing in a highly competitive market. Any increase in competition and content war will slow DTC’s top line growth and increase DTC’s content spending, significantly crushing the margin. Even in our base case, the company only produces about $7.9 billion over the next five year when the company spends about $14 billion in content annually.
Secular Declining Revenue Mix: the company’s revenue is comprised of 60% TV Media, 30% DTC, and 10% Theatrical. TV Media is secularly declining industry, and any faster than expected decline in TV Media could significantly damage the company’s ability to invest in its growth, DTC.
Poor Earnings Quality and FCF Sensitivity to Content Accounting: the management has changed its KPI multiple times over the past five years and is expected to change its segment breakdown for 2026, which is concerning. Also, two factors (amortization % of content cost and ∆ Working Capital / Content Cost) significantly drive FCF projection. If those factors were to return at “growth phase level” (i.e., that is 2021-2025), the company will experience negative cash flow for the next five years, leading to potential downgrade to B.
BB Spread Priced in But Potential Spread Widening: although the bond is already priced near BB spread, the spread is almost at historically low level. If the bond gets downgraded and BB spread widens to historical average level, it will result in 1yr price return of -2.46%.
INDUSTRY OVERVIEW:
TV MEDIA - the TV media (cable networks, broadcast, and linear television) is in structural decline as audiences and advertisers shift toward digital and streaming platforms. The industry (advertising) is cyclical and expected to contract modestly over time.
Cyclical advertising and structurally declining industry (in affiliates)
Political events and Sports events offer “advertising surprises”
STREAMING - the video streaming industry is structurally growing but has entered a more mature phase signaled by slowing subscriber growth, rising competition, increasing consolidation, rising churn rate, and a shift toward profitability. Growth is increasingly driven by pricing actions, advertising tiers, bundling, and international expansion rather than rapid net adds in subscribers. Moderately concentrated market with C4 = 68%:

The demand for streaming has three key drivers:
Continued migration from traditional TV to streaming (cord-cutting)
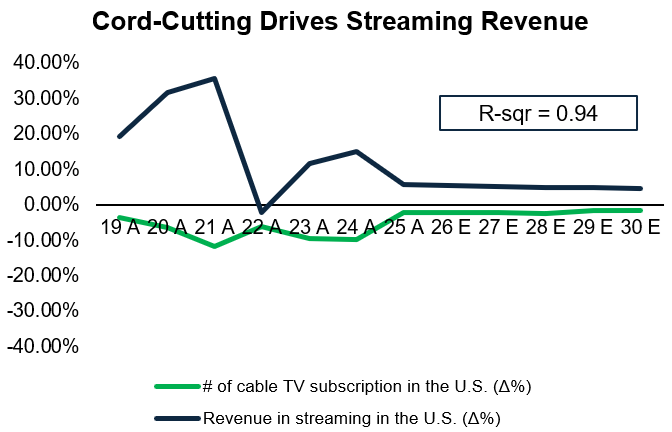
Cord-cutting drives net add into subscription
As cord-cutting slows down, streaming revenue growth expected to slow down
Less cyclical than expected
Switching based on availability of differentiated and exclusive content
>50% of consumers have canceled and late re-subscribed when new content was released (churn)
70-80% of consumers say availability of content is the primary factor when subscribing (net add)
Expansion of ad-supported, bundling, and flexible pricing models
31% of consumers use FAST (Free/Ad-Supported Viewing) (net add)
FILMED ENTERTAINMENT - the filmed entertainment (theatrical releases, content licensing, and digital distribution) shows modest long-term growth, but has high volatility driven by box office performance. The industry is very cyclical, and its performance primarily depends on timing of film slates and franchise releases (hit-driven).
COMPANY OVERVIEW:
Paramount Skydance Corp (“Paramount”) is a global media, streaming, and entertainment company that creates and distributes content across traditional television (“TV Media”), digital streaming (“DTC”), and theatrical platforms (“Theatrical”). Paramount has a diversified portfolio of well-known brands as CBS, Paramount Pictures, Nickelodeon, MTV, BET, and Paramount+, as well was one of the largest film and content libraries. The company is focused on leveraging its content libraries and ecosystem to expand its DTC (29% of revenue) while reducing TV Media (61%), which has been secularly declining and maintaining Theatrical (10%).
TV Media (61% of revenue) generate revenues from advertising, affiliate and subscription revenues, and licensing and distribution of content and other rights. TV Media is generating 20+% OIBDA margin and reinvesting its cash flow into more promising Direct-To-Consumer.
Secularly declining affiliate and subscription fees with declining advertising
Purposely declining licensing and distribution (-9% CAGR), pulling its content out of third parties and exclusively showing on its Direct-To-Content
Direct-To-Consumer (29% of revenue) is lagging its market leaders (Amazon Prime Video, Netflix, and Disney+) but reflected strong growth over recent years as the company expanded its DTC. Revenue has grown at 23% CAGR since its expansion in 2021, driven by net adds, ARPU expansion, and growth in advertising.
+10% (5yr CAGR) growth in the total number of SVOD subscribers
+13% (5yr CAGR) expansion in ARPU ($/month)
The growth of Direct-To-Consumer revenue is most critical in our credit analysis
Theatrical (10% of revenue) shows stable growth with cyclicality primarily driven by hit movies. The segment is expected to remain stable with couple “surprises”:
Release of Mega-Hit Film
MANAGEMENT:
After the merger of Paramount and Skydance into a Paramount Skydance, David Ellison became chairman and CEO. David Ellison has a proven record of founding and operating Skydance Media for almost 20 years. Ellison repeatedly mentioned his plans to transform Paramount into a technology-driven media company with heavier focus on Direct-To-Consumer and immediately laid off 2,000+ people to support this transformation. Many new C-Suites like Cindy Holland (former Netflix executive) and Jeff Shell (former NBCUniversal CEO) are hired to expedite the transition.
FINANCIAL STATEMENT ANALYSIS:
i) Revenue and Profitability:

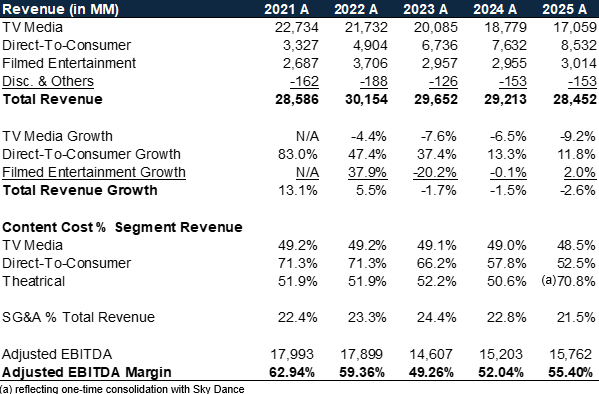
Paramount is strategically shifting its revenue base. It is lowering TV Media, a secularly declining industry, and increasing Direct-To-Media, a faster growing industry, to give overall growth to the company.
TV Media
Secular declining industry with revenue growth of -5.7% CAGR, declining faster than the cable industry in the U.S. that had -4.3% CAGR, mainly due to significant decrease in licensing from removing its content from third-party and adding to Paramount+ and related streaming services
Declining margin with lower advertising deals from lower subscription base and less licensing to third-party
Direct-To-Consumer
High growth is driven by increase in number subscribers for Paramount+ (19.2% CAGR) and ARPU (11.7%). DTC revenue (20.7%) grew much faster than overall streaming industry (5.8%). Paramount+ is in growth phase, while others are maturing
Margin increasing (high fixed cost structure with scaling revenue). Most of content cost is fixed, and fast top line growth can absorb its cost (e.g., Content Cost % DTC Revenue dropped 71.3% -> 52.5% as top line growth accelerated)
Filmed Entertainment
Modest growth with occasional hit-driven earnings volatility
Overall EBITDA margin has been decreasing from 2021 – 2023 as the company lowered its high margin TV Media business and increased high content spending needed Direct-To-Media. However, DTC is fast growing and begins to extract higher margin as it approaches later phase in growth cycle. The expansion in EBITDA margin is primarily driven by lower SG&A from restructuring and lower content spending as business enters later growth stage as shown by margin expansion in 2024 - 2025.
Concerning Quality of Earnings
EBITDA margin is mainly driven by content accounting (i.e., amortization)
Low cash conversion
KPI (definition of subscriber) continues to change (e.g., Global subscriber -> Paramount+ Subscriber -> Paramount+ Subscriber Excluding Free Trial)

ii) Cash Flow, Liquidity, and Capital Structure
The company has about $3.39 billion maturing in next five years with $3.27 billion in cash and cash equivalents and $3.50 billion in unused credit revolver (which decreases to $3.44 billion 2027 and matures in 2028, which is also subjected to max leverage of 4.5x). Paramount has sufficient liquidity.
There are about $28 billion on and off-balance sheet obligations. However, most of off-balance sheet commitments (programming and talent commitments of about $25 billion) can be pushed off, which, however, could potentially slow the revenue growth. And the company also $1.9 billion in letters of credit related to obligations.
However, major concern is its cash flow. Even in our base case, the company generates $8 billion in free cash flow over the next five years, which is only 60% of annual content-related spending. Also, there is little potential to lower CAPEX or change in working capital (which is content spending) as the industry is currently in a content war. Increase in content cost or slow down of DTC’s top line growth will lower margin from less fixed content cost abortion.


Further, Paramount has more than enough cushion of $12.9 billion comprised of equity and junior subordinated debt.
KEY RISKS AND MITIGANTS:
The primary risks for Paramount are increasing content spending, deceleration of Direct-To-Media growth, increase in amortization of content spending (content impairment), and secular decline and cyclicality in TV Media and advertising.
Increasing Content Spending: the management’s medium-term goal is to increase topline growth of DTC, which requires heavier content spending. Free cash flow is primarily driven by content spending, and increase in content spending will result in negative cash flow
Mitigant: our projection includes content spending % per segment revenue, amortization % of content spending, and change in WC (content inventory) % of content spending to account for different scenarios
Deacceleration of Direct-To-Media Growth: although DTC has been growing at 20.7 CAGR for the past five years, the competition in streaming is increasing, which could potentially deaccelerate DTC top line growth
Mitigant: our projection (even for base case) is very conservative given increase in competition and slower projected growth for overall streaming industry
Increase in Amortization of Content Spending: bad investment in content leads to high amortization of content spending. If management continues to make bad investment, it could materially impact both cash flow and balance sheet
Mitigant: our projection for base case baked in average amortization rate % content spending, and our downside baked in historically worse amortization rate % content spending
Secular Decline and Cyclicity in TV Media and Advertising: although the company is less dependent on TV Media than before, it still accounts for majority of revenue. Faster than expected decline in TV Media could potentially harm the company’s ability to invest in DTC.
Mitigant: our projection is very conservative, and downside case includes faster than industry average decline, which is less likely to happen given CBS and its related broadcast’s extensive franchise and penetration
Fail to Restructure: Paramount has been restructuring for past three years and is expected to continue restructuring post Skydance merger. Failure to restructure will lower margin.
Mitigant: in both base and downside case, we did not add back restructuring charges (related to severance and exit cost) as we believe Paramount will continue to restructure its TV Media and exit many of related lease contracts.
Warner Bros. Acquisition: if Paramount acquires Warner Bros., it will significantly affect its leverage ratio.
We believe it is beyond the scope of the analysis and expertise, so did not include in any of the scenario.
FORECAST:
Although company uses OIBDA and is shown in the model, our EBITDA forecast and margin is primarily driven by Content Cost growth, Amortization % of Content Cost, and SG&A rather than OIBDA margin. OIBDA and margin is shown for reference (not used for EBITDA calculation).
Our scenario analysis is primarily driven the industry trend of # of cable TV subscription in the U.S. (shown in page 2), as we have identified it having r2 = 0.94 with revenue growth in streaming in the U.S. We have used such industry trend as a proxy for both TV Media and Direct-To-Consumer and adjusted their relative performance against the industry trend.
Using historical data, we assumed fixed portion of SG&A $ 3,000 million and ran a solver to come up with beta for each business segment. Forecasted SG&A = Fixed SG&A + Previous SG&A * Beta of Each Business * (1 + Business Segment Growth)
Content Cost % of Revenue was assumed based on historical level and trend.
Base Case:
TV Media – Advertising: assume historical secular decline rate (-4%) when # of cable TV subscription in the U.S. decreased by -2.3%. The # of cable TV subscription in the U.S. is expected to decrease at a much lower rate, and thus giving -4% is conservative. Also, assumed political impact volatility (+3%) for Mid-term election in 2026 and Presidential election in 2028 based on historical trend.
TV Media – Affiliate and Subscription: assume identical growth with # of cable TV subscription in the U.S., and ARPU growth of 2% (matching inflation)
TV Media – License: assume expedited decline (-7%) to pull more content from third parties and move it to Paramount +
Direct-To-Consumer – # of Subscriber: assumed 1.3x inverse growth of # of cable TV subscription in the U.S. Cord-cutting has been the major driver in growth of subscriber, and Paramount+ is in growth phase compared to its competitors.
Direct-To-Consumer – ARPU: assumed Paramount+ will enter mid-tier phase (i.e., not industry leader but maturing) by 2030.
Direct-To-Consumer: based on assumptions, DTC will grow at 5yr CAGR of 6.2%, much slower than past 5yr CAGR of 20.7%, but still above the industry CAGR of 4.8% because it is in growth phase.
Direct-To-Consumer: content spending / segment revenue will continue to decrease and stabilize around 52%
Assumed Amortization of Content Cost 92% (historically 92~93%)
Assumed ∆ Working Capital (Content Inventory) of 0.97 reflecting recent trend


Downside Case:
TV Media – Advertising: assume decline rate at a historically level. # of cable TV subscription is expected to decrease at a much lower rate (-1.6% compared to -5.7% CAGR for the past 5 years), and thus, this is aggressive assumption of losing pricing power on top of faster cord-cutting
TV Media – Affiliate and Subscription: assume 10% faster decline compared to the decline in # of cable TV subscription in the U.S., and ARPU growth of 1% (lower than inflation signaling further loss of pricing power). This is aggressive given CBS and related broadcast, and cable has 98% penetration in the U.S.
TV Media – License: assume expedited decline (-7%) to pull more content from third parties and move it to Paramount +. However, expected to have one more labor union. In 2024, Licensing dropped by 22.6% due to labor strike, and it is more than likely to happen again.
Direct-To-Consumer – # of Subscriber: assumed 1.0x inverse growth of # of cable TV subscription in the U.S. Cord. This is aggressive given Paramount+ is relatively new and still in growth phase.
Direct-To-Consumer – ARPU: assumed Paramount+ will enter mid-tier phase much faster by 2028 from rising competition.
Direct-To-Consumer: based on assumptions, DTC will grow to a 5yr CAGR of 4.0%, much slower than past 5yr CAGR of 20.7% and the industry CAGR of 4.8%. Again, this is aggressive given Paramount’s growth compared to its competitors who are maturing.
Direct-To-Consumer: competition intensifies and content spending / segment revenue breaks downward trend and increases and stabilizes around 65%
Assumed Amortization of Content Cost 94% (historically 92~93%)
Assumed ∆ Working Capital (Content Inventory) of 1.02 reflecting need to spend more on content from higher amortization and increase in competition (2021-23 level)
Theatrical: labor union strike (-4% similar to 2023 labor strike, content cost % of revenue increases 52% -> 56%) and content cost % revenue base increase 52% -> 53% to account for increase in revenue related to labor strike

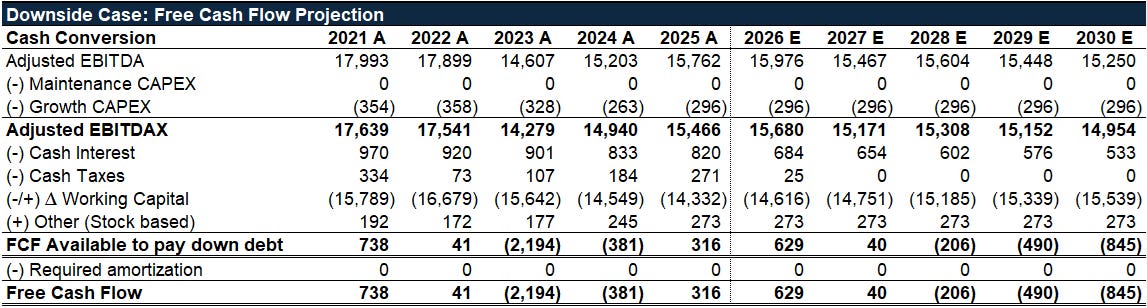

Major Concern: EBITDA is hugely inflated by content accounting, and FCF is extremely sensitive to content related expenditure. ∆ Working Capital which is amount of capital spent on content significantly affects FCF projection. Year 2021-23, ∆ Working Capital / Content Cost is about 1.03. Year 2023-25, ∆ Working Capital / Content Cost is about 0.965. Although, it is less likely to hit 1.03 when Paramount+ was just starting to get attention, it is likely to be near 1.00 from increasing competition from content war.
RETURN / RELATIVE VALUE ANALYSIS:

Although Paramount is still an investment grade bond, its bond is already priced at BB spread. Given the company’s content accounting and inflation of EBITDA, the analysis should be focused on FCF/Total Debt, and FCF is most likely trigger credit rating movement.


Given that Paramount is already priced at BB, and its expected value of FCF/Total Debt (70% probability of base, and 30% probability of downside) of BB’s ratio, I believe it is more likely than not to get downgraded to BB. Therefore, I recommend underweight.

Additionally, given that current spread for BB is historically low, if the spread were to widen to historical average, it will result in price change of -2.46%.

Although the management in 25 4Q shareholders letter said, “Our capital allocation priorities remain: … Manage our balance sheet to regain and then maintain investment grade credit metrics,” it will require cutting content spending, which would decelerate DTC growth, which is their priority. Therefore, it is less likely to happen.
Thank you for reading. Please feel free to email me or leave a comment if you have any thoughts or differing perspectives.
This was good. Great format, keep it up!